
Renewable PPA Primer: Financial Risk Assessment for Corporate Energy Buyers
October 16, 2018
Renewable energy purchases by large corporations are accelerating. In 2017, large corporates bought over 5 gigawatts of renewable energy and we are on-pace to shatter this number in 2018 with over 7 gigawatts already purchased this year (Bloomberg article August 2018). Telecoms and large technology companies are leading this charge and mainstream Fortune 1000 companies are not far behind. In this rush to acquire renewable energy for sustainability and green energy supply, many companies are forgetting that these deals can come with substantial financial exposure. Google may be able to afford significant losses in its renewable energy portfolio. Can you?
The effective lifetime of renewable energy deals, such as a power purchase agreements (PPAs), is measured in years. Increasingly, corporate entities are opting for financially-settled PPAs known as “contracts for differences” (CFDs). The number of CFD variations in the market is staggering, with each delivering a slightly different risk profile to the buyer. If the buyer is on the wrong side of this risk when market conditions change, he can end up with many years of making monthly “wrong way” payments to the seller instead of collecting revenue from his PPA.
Obviously, it is impossible to predict the weather, energy prices, availability, and demand over this entire future horizon, though each of these components can materially impact the contract value. Experienced energy companies, such as large utilities and global energy trading firms have been managing these risks for a long time. How, do they do it? They use sophisticated simulation models to predict the range of possible future outcomes and the most likely outcome. This allows the company to develop an expectation of their future cash flows, quantify the uncertainty around future cash flows, and mitigate risk using custom-tailored risk-reduction strategies.
If the renewable energy seller is using these techniques to construct a renewable PPA for the buyer, you can be sure the deal’s terms are skewed in their favor. My hope is that this primer will give corporate renewable energy buyers a better understanding of the financial risks involved and how to mitigate them.
Electricity Prices
Electricity (or power) prices exhibit dynamics that are fundamentally different from other financial products or commodities. One driver of these differences is that it is not cost-effective to store large quantities of electricity, except over short time periods. Another driver is that power system reliability (i.e., “keeping the lights on”) requires a constant balance between production and consumption. At the same time, electricity consumption (demand) depends both on weather and the intensity of business activities and can be highly uncertain. The availability of electric generating assets to meet demand and the associated costs to do so ultimately determine electricity prices at any particular time and location on the grid. These unique and specific characteristics lead to price dynamics not observed in any other market, such as seasonal and intra-day fluctuations that tend to differ widely by geographic location.
Since it is impossible to know with complete certainty what the electricity price will be in any given day/hour in the future, price simulation techniques have evolved to capture the unique dynamics of electric power markets and to simulate future outcomes in a probability-weighted format. Analysts want to know both the range of possible prices and the probability that a particular scenario will occur. For example, we know that in some electricity markets prices can range between negative values and up to $9000/MWh. However, it is equally important to understand the probability and timing of large price movements, as well as how prices move in relation to other factors.

Example of simulated hourly day-ahead electricity prices for the Mid-Columbia trading hub. This chart shows 5 simulation paths. Notice the strong seasonal shapes in each of the four seasons, as well as marked differences in price volatility throughout each year.
Robust price simulation models employ a Monte Carlo, mean-reversion, jump-diffusion methodology to simulate electricity prices. This methodology was first introduced to the financial markets in the 1990s and migrated to the energy markets a few years later. They have been widely used by traditional energy companies for nearly 20 years. This robust price simulation methodology allows the financial analyst to have confidence that their contracts are being valued against hundreds of internally consistent future versions of the electricity markets and that the “expected future value” can be relied upon.
Wind & Solar Generation
Renewable energy is inherently intermittent. Unlike a natural gas generator that can be ramped up or down at-will, the wind blows and the sun shines based on the irregularities of nature. This makes wind and solar production difficult to predict over long time periods with a high degree of accuracy. As with electricity prices, methodologies have emerged to simulate future renewable energy production.
The preferred methodology to forecast future renewable generation uses curated databases to access historical wind speed and solar irradiance patterns at any geographic location. Robust simulation models use these historical weather patterns and the physical characteristics of the renewable generation facilities (e.g. geographic location, wind turbine type and height, solar panel tilt angle, etc.) to generate Monte Carlo simulations of future energy production at the specific asset location.
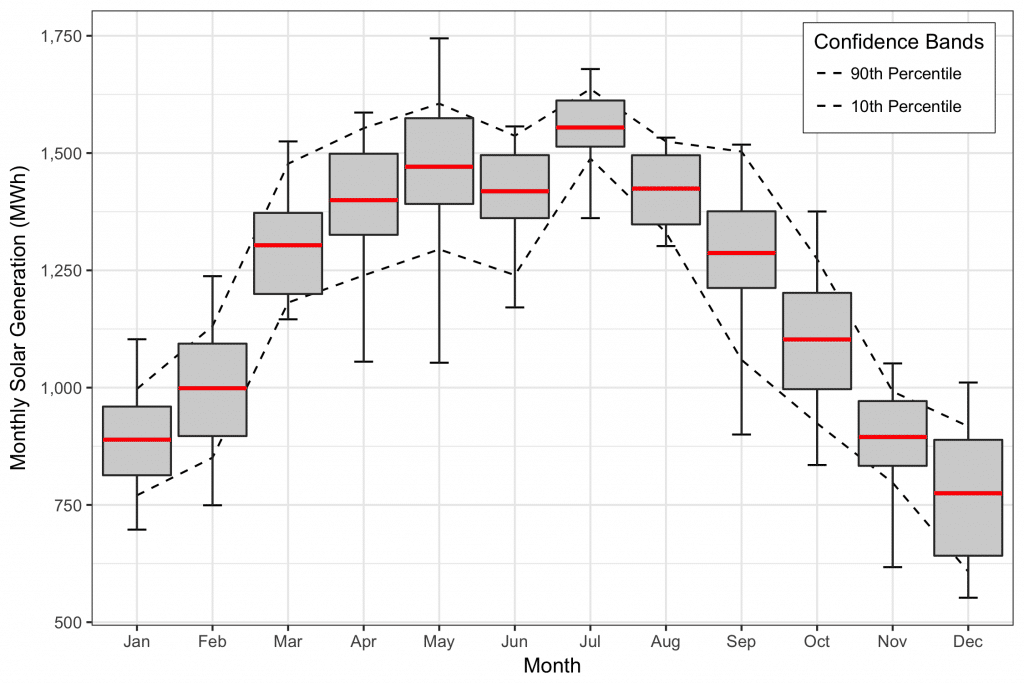
“Box-and-whisker” plot of total monthly solar production for the 10 MW Pennsylvania Solar Park. Red horizontal lines denote the expected value (mean), boxes range from the P25 to P75, and whiskers extend to the min and max of total monthly generation, as implied by historical weather data.
The combination of hourly Monte Carlo simulations of renewable energy generation and real-time market prices at the resource node and/or settlement hub provides hourly distributions of market value for the renewable energy produced. The stochastic time series models used to generate the simulations are parameterized from historical market prices and solar irradiance or wind data. The parameterization process ensures the modeled output reflects locational patterns in expected price and renewable generation as well as variability around the mean. As such, simulations capture the real-time interplay between energy production and market prices, allowing users to understand the true value of and uncertainty in energy production at the seasonal, daily, and hourly level for a particular generation facility.
The simulated hourly generation and market prices can also be used to directly value renewable PPAs along with the unique “contract-for-differences” (CFD) financial structures they may entail. Examples of a few settlement structures that can be directly modeled include fixed price, $0 minimum, collar, revenue share, and many others.
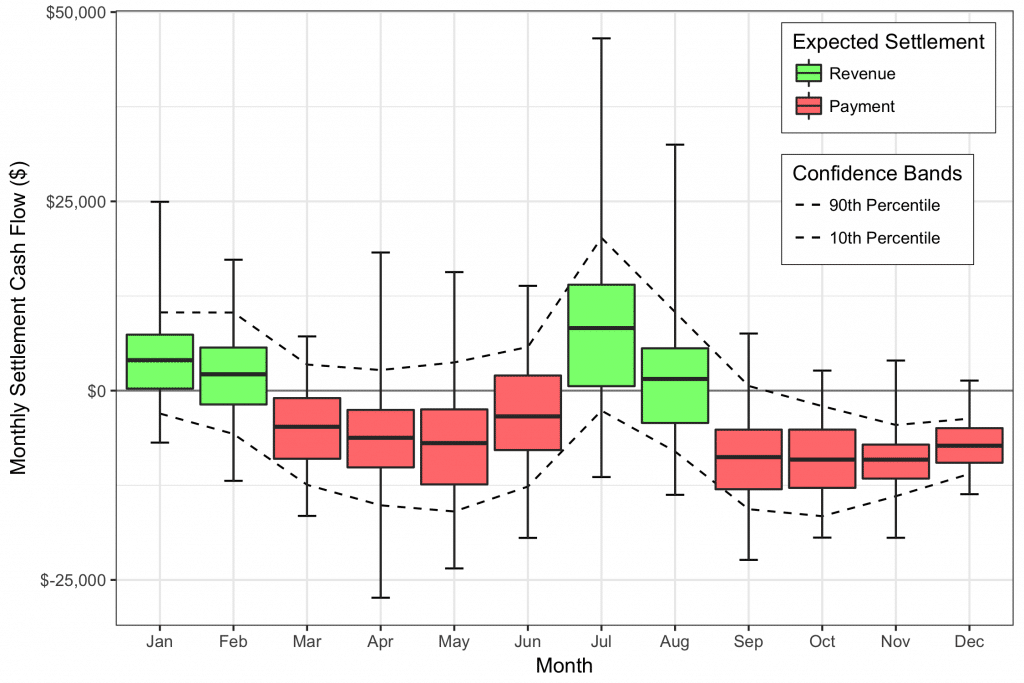
Simulated contract-for-differences monthly settlement amounts (year 2022 only) for a PPA struck at $35/MWh for the Pennsylvania Solar Park.
How does this analysis help Renewable PPA buyers?
Some corporate buyers of renewable PPAs have experienced significant “wrong-way payments” and financial losses since contract signing. In almost every case, those buyers used the analysis provided by the seller as their reference of fair value for the contract. It comes as no surprise that the sellers often used optimistic forecasts of future value and downplayed the effects of uncertainty. A robust financial risk assessment and valuation model helps buyers of wind and solar renewable energy understand the true value and risks associated with long-term PPAs. Moreover, it provides an unbiased assessment of fair contract value from an independent third party that has no stake in the deal. This can add significant leverage to the buyer’s position at the negotiating table.
With a proper financial analysis, PPA buyers should be able to report fair market value for existing or proposed PPAs, as well as the degree of uncertainty around monthly settlement cash flows and the effect this uncertainty has on overall contract value. Armed with this information, renewable PPA buyers are in a much better position to negotiate on contract terms and pricing, resulting in higher rates of return over the contract lifetime. Buyers no longer need to rely solely on the seller’s own assessment of value when signing long-term renewable energy contracts.
ReAssure® for Renewable PPA Buyers
cQuant.io’s ReAssure model uses well-established valuation methods to demonstrate fair value and financial exposure for renewable assets and power purchase agreements (PPAs). The use of Monte Carlo market price simulations coupled with simulations of generator production is a technique that has been used for decades to manage portfolios that include dispatchable thermal generation assets and financial contracts. With ReAssure, cQuant.io has applied these seasoned techniques to the valuation of wind and solar projects and PPAs.
ReAssure combines simulations of hourly electricity prices and hourly renewable energy generation to calculate a broad range of possible future scenarios of the true market value of generation. Each simulation is custom-tailored to project-specific parameters such as precise geographic location, nameplate capacity, tilt angle (solar), turbine manufacturer and model number (wind), and market pricing node or hub. These simulations capture the real-time interplay between energy production and market prices, providing a comprehensive bottom-up analysis of the true value of and uncertainty in renewable asset or PPA cash flows.
The example output image below shows the expected fair market value of a 5-year renewable PPA, as well as the simulated distribution of possible. The expected value gives the renewable PPA buyer a single number to consider when making a buying decision while the spread in the distribution provides an indicator of the risk in the deal related to variability in renewable energy generation and wholesale electricity market prices. With these key metrics in-hand, buyers can make an informed decision to purchase a particular renewable energy contract. They can also quickly compare value and risk across many different proposed contracts and locations to determine the best deal for their renewable energy portfolio.
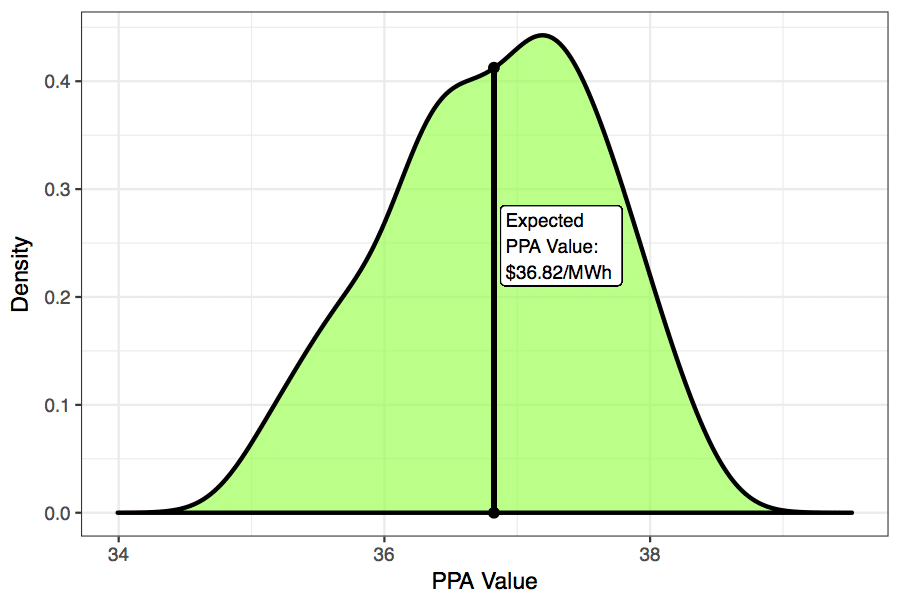
Simulated market value of electricity generated from 2018 through 2022 for the Pennsylvania Solar Park.
About cQuant.io
cQuant.io is an industry-leading provider of cloud-based energy analytics solutions. cQuant’s advanced analytics platform provides sophisticated energy-focused models across a wide range of industry verticals, from renewable energy project development and contract structuring to thermal generation asset analysis, hedge optimization, and exotic derivative valuation. Visit cQuant.io for more information and request your free demo today.