
J.P. Morgan Center for Commodities: Three Steps to Understanding Value and Risk in Renewable PPAs
July 17, 2018
This article is based on the author’s recently-published article in the JP Morgan Center for Commodities Global Commodities Applied Research Digest (GCARD).
Renewable power purchase agreements (PPAs) have long been important enablers of renewable energy development. However, like any structured transaction, PPAs come with a certain set of risks that the buyer should fully understand before committing to the deal. Each wind or solar facility has its own unique signature governing both the timing of the renewable generation and the value of that generation at the time of production. A proper understanding of value and risk for a renewable PPA requires analyzing how generation and market prices align in real-time at the specific location of the facility underlying the contract. This includes a detailed statistical understanding of three important components of the deal:
- The real-time generation signature of the project underlying the PPA
- The real-time market price signature where energy from the PPA is fed into the grid
- The real-time alignment of generation and market prices
The Generation Signature
Each renewable project site comes with its own unique generation profile, or signature. This signature defines not only how much energy will be produced, but, importantly, when the energy will be produced and how uncertain the production will be. For example, consider the signature of a solar farm in New York compared to a solar farm in Arizona. Even if the total annual energy from the two facilities is the same, these two locations will have starkly different generation signatures.
The New York solar farm, being further north, will have more seasonal fluctuation in generation due to the dramatically changing number of daylight hours over the course of the year. Since Arizona is further south, it will have less of a difference between the length of day in summer and winter. Being east of the Great Lakes, New York has much more moisture in its atmosphere than Arizona, which leads to more cloudy days and correspondingly greater variability in solar generation day-to-day. In particular, New York winters tend to be particularly cloudy and produce significant snowfall, further contributing to depressed solar generation during the coldest months of the year compared to the warm, arid Arizona desert.
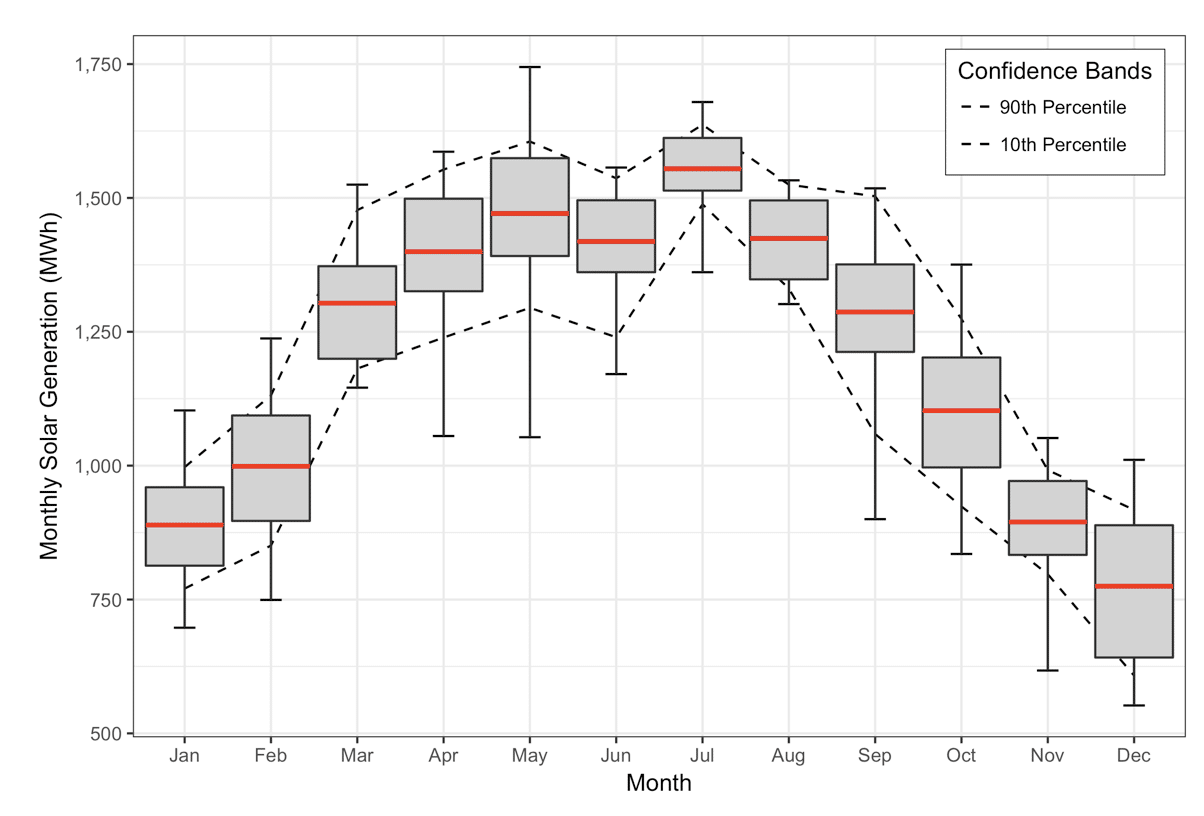
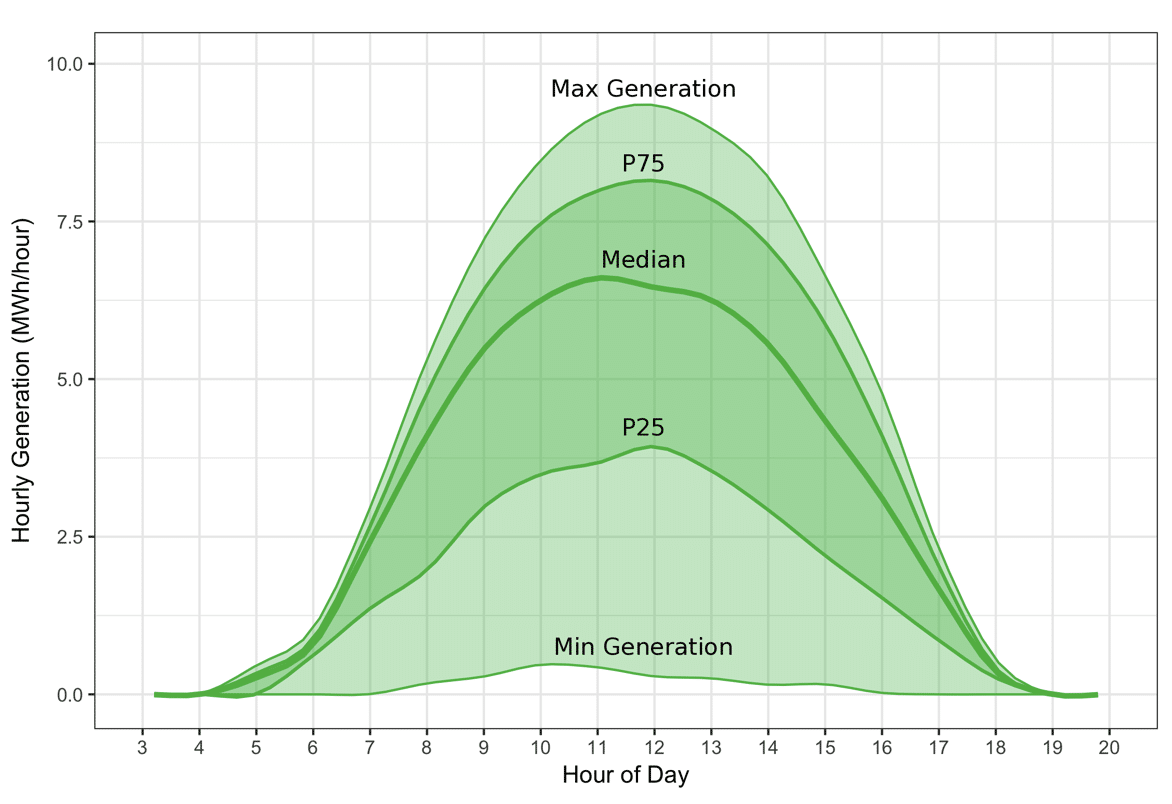
By analyzing historical weather patterns and historical solar radiation, we can compose a fairly complete statistical picture of the solar generation signature in each of these locations. It is important to understand the generation signature at the hourly level, and how it changes over the course of the year. By doing so, we obtain not only an expectation of how much electricity each facility will produce in each hour of the year, but we gain an understanding of how uncertain this estimate is. We’ll come back to this uncertainty in the third component of understanding PPA value and risk.
The Price Signature
The second component of the PPA to understand is the real-time price signature. Just as each location has its own patterns of generation, so too does each price location have its own unique price signature. The price signature is highly complex and depends on many different local factors including weather patterns, demand for electricity, generation availability and type (e.g., natural gas, coal, hydro, renewable, etc.), transmission infrastructure, fuel price, and governmental policy and regulations, to name a few. Despite all this complexity, there are two useful indicators of a particular location’s price signature that provide insight when assessing PPA value and risk: historical real-time spot prices and current forward contract prices.
The historical real-time spot prices provide a record for how the particular price location has behaved in the past. Some prices may be extremely volatile while others may be more predictable. Some may show enormous variability across each day while others may have a flatter shape. Some may change shape seasonally while others may remain more constant throughout the year. Teasing out these price trends from historical price history is essential to building an understanding of when electricity is most valuable at a particular price location and when value is most uncertain. Both of these components are directly tied to the value and risk the PPA will have over its contract term.
The second pricing component that sheds light on market expectation at the pricing location is the current forward contract price. This is the price agreed upon today for electricity to be delivered at some point in the future. Together the set of forward prices across a range of future delivery periods is called the “forward curve”, and this forward curve is one reflection of the current market expectation of what prices will be in the future. Not every pricing location has a liquidly-traded forward curve, so, in many cases, seasoned insight and understanding of financial electricity markets must be used to develop a forward curve specific to a given project. Whereas the historical spot price record provides insight on real-time price shape and variability, the forward curve provides insight on the absolute price level out in the future. Together, these two pricing components form the real-time price signature for the PPA.
Generation and Price Alignment
Having an understanding of the generation and price signatures individually is not sufficient to understand their effects on PPA value and risk; we have to also understand how they align in real-time. The value of the electricity generated under a PPA is the product of generation and the market price at the time the generation occurs. The multiplicative effect can magnify uncertainty and risk in one of these quantities relative to the other. For example, if market prices tend to dip down at times when generation is highest, the overall net effect will be a reduction in average PPA value. However, the high generation will magnify the downside risk of the low market prices, causing a greater net loss than if generation were at lower levels. Similarly, if market prices tend to spike when generation is low, the benefit to the PPA of high market prices will be reduced by lower-than-average generation.
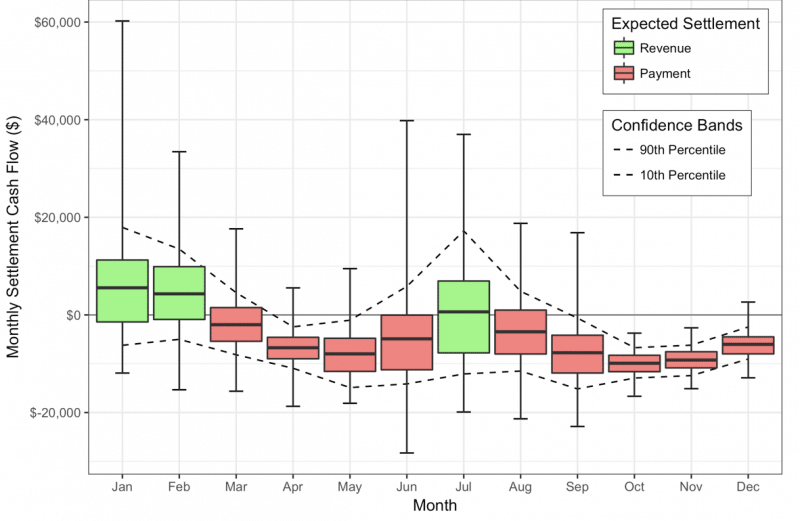
The alignment between the generation and market prices signatures is a primary driver of both PPA value and risk. Because this alignment is constantly changing as markets evolve and more renewable generation is placed in service on the grid, a simulation-based approach to generation-price alignment can be an excellent way to probe a wide range of possible scenarios and assess the effect of each on overall value. A Monte Carlo simulation approach like cQuant.io’s ReAssure PPA valuation and risk assessment model can uncover the signature of generation and real-time prices for a particular PPA location while also providing insight into how the alignment of these two signatures drives PPA value and risk.
The next time you or your organization is looking to sign a long-term renewable PPA, make sure you don’t go into the transaction blinded by “greenwashing” claims and promises of positive NPV based on optimistic (or worse, faulty) analysis and forecasting. Make sure you demand to understand the signatures of real-time generation and real time market prices and how the two interact to drive value and risk for your particular PPA. Anything less, and you just may be signing a deal that could come back to bite you.
This article is based on the author’s recently-published article in the JP Morgan Center for Commodities Global Commodities Applied Research Digest (GCARD). For more details, please see the full article beginning on page 29 of the Summer 2018 issue of the GCARD here.
Brock Mosovsky, Ph.D., is VP of Analytics at cQuant.io, a cloud-native SaaS analytics company, providing robust solutions to meet today’s market and regulatory challenges.
Need a solution for your energy analytics? We can help!
Request your free demo today.
