“100% Hedged” vs. “Risk Free”: Understanding the Difference
June 30, 2021
Any energy market participant realizes that uncertainty in future prices of electricity and fossil fuels means risk exposure for their portfolio. Extreme weather, new government regulations, or changes in global supply dynamics can quickly erode profits or even spell ultimate disaster for companies on the wrong side of the resulting price swings. Rather than leaving their portfolio exposed to today’s highly volatile energy market, portfolio & risk managers look to hedging as a way to shore up uncertain cash flows from an asset or portfolio of assets. Forward contracts, European options, heat rate call options, revenue put options, basis swaps and even batteries can all act as effective hedges for the right underlying portfolio. Payoffs from a “perfect hedge” are 100% inversely correlated to the financial risk in one’s portfolio; however, perfect hedges rarely exist in practice. Instead, portfolio managers tend to think in terms of “percent hedged”, which is a different concept altogether. Under this view, even if the portfolio is “100% hedged”, there may still be appreciable risk to the future cash flows. Why is this?
The reason there is still residual risk even after being “100% hedged” is that there is typically “slippage” between the payoffs of the hedge contracts and the assets they’re hedging. This sort of slippage is common and usually unavoidable, and it can occur due to a wide variety of reasons. The images below provide an example of simulated annual gross margin for a baseline portfolio consisting of several thermal generating assets. These assets are real options with very complex operational constraints (e.g., minimum up/down times, fixed and variable startup costs, etc.) and each simulation represents a possible outcome for the annual gross margin of the portfolio relative to these constraints in conjunction with possible future market prices. The hedges in this portfolio are standard over-the-counter swaps (i.e., forward contracts), which are linear instruments with no optionality.
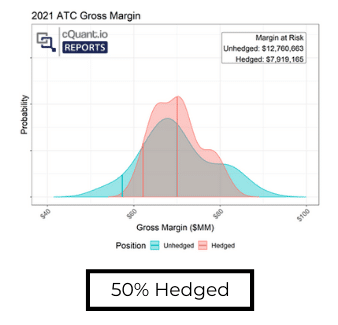
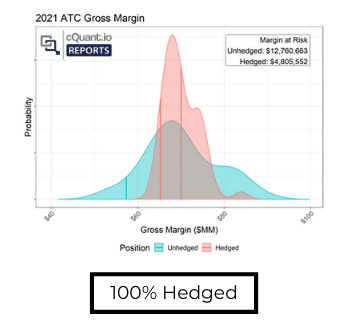
The 100% hedge was designed relative to the expected power generation and fuel consumption of the generating assets, but their ability to cycle and modify their output as market prices deviate from expectation means that there will be days, weeks, or months in which the assets generate more than expected and others in which they generate less. In these instances, the fixed volume of a pre-specified hedging program is misaligned with the unit’s generation. Additionally, there may be misalignment in the timing of the asset volumes (which may vary hour-to-hour due to cycling/ramping) and the hedge volumes (which are fixed over the month, by peak period). This slippage results in the residual risk seen in the image for the 100% hedged scenario. While the assets can never have their risk 100% neutralized (e.g., they’ll never be truly “risk free”), the images demonstrate the risk reduction that can be achieved with a simple strategy that leverages forward contracts and can be easily designed with access to a robust simulation framework.
Basis is another important component of hedge slippage that must be considered. The plants will earn revenue off the nodal power price (the generation bus) while hedges are contracted at liquid trading hubs, which represent baskets of nodal prices within a region. Due to congestion and line losses, the nodal prices often differ from the hub prices, resulting in differing payoffs for the physical asset and the hedges even when volumes may be perfectly aligned. Other risks such as operational risk (e.g., forced outages), weather risk (e.g., plants operating less efficiently due to extreme heat), and others can contribute additional slippage to a hedging strategy as well. There’s no such thing as “risk free” when it comes to managing energy assets, but the right analytical framework can help you understand the financial risk specific to your portfolio and take data-driven steps to mitigate it.
At cQuant.io, we’ve built an energy analytics platform with easy-to-use models that can help companies quantify hedge effectiveness, risk reduction value, and the net position impact to their portfolio. Our web-based interface provides access to powerful analytic models that let you understand your portfolio’s market exposure and take steps to mitigate your risk. Visit cQuant.io for more information and request your free demo today.