CCA Portfolio Analytics

Business Questions
What is my portfolio’s expected net short position in terms of MWh, RECs, GHG-Free credits, and resource adequacy (RA), and how much uncertainty is there around this position?
I have received many responses to my renewable + storage RFO; how can I determine which contracts are best for my portfolio?
What is the net effect of adding a particular contract or asset on my portfolio’s cash flow risk?
What is a fair premium to pay for firm-volume renewable energy compared to PPAs that deliver unit-contingent energy?
How will bundling energy and attributes in long-term PPAs to satisfy my RPS requirements affect my portfolio’s exposure to market risk?
If negative covariance (e.g., renewable penetration risk) between renewable generation and market prices worsens, how will my portfolio be impacted?
The Need for Analysis
Procurement decisions are rarely optimized by considering cost implications alone. There can be important risk reduction benefits from examining resource mix (wind, solar, hydro, etc.), evaluating a range of complex contract structures (price collars, volume-firming agreements, proxy generation/revenue swaps, etc.), and/or considering geographical diversification within the procurement decision-making process. Such “portfolio-level effects” can have very real benefits in terms of reducing overall cost to serve load, and hence, the cost rate-payers must pay for energy.
Understanding the interactions between the various components of a CCA’s portfolio requires detailed analytics that capture the important relationships driving value and risk. Basis risk, generation-price covariance risk, weather-load dynamics, hedge effectiveness, hourly shape risk, and overall net position at risk are all metrics that can yield insight into how shielded (or not) a portfolio is to unexpected changes in the market. A robust and holistic simulation-based analytical approach is essential to accurately computing these metrics.

The cQuant.io Solution
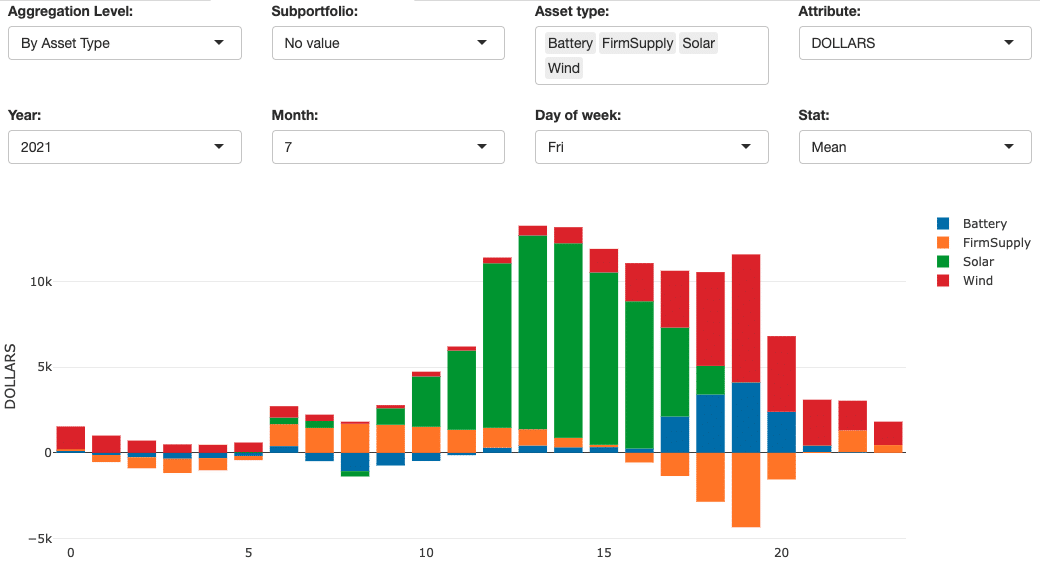
cQuant’s CCA Portfolio Analytics solution delivers a comprehensive view of value, net position, and the risk associated with each at the total portfolio level and across a wide variety of user-defined subportfolios. Users can track net attribute position and net position at risk (NPaR) for cash flow, MWh, RECs, GHG-Free requirements, various flavors of resource adequacy (flex, local, and system), and other custom attributes. Intuitive in-app dashboards help condense the analysis into insightful reports that can directly inform risk mitigation strategies, procurement decision-making, and other ongoing portfolio management activities.
At the core of cQuant’s analytical framework lies a robust Monte Carlo risk factor simulation suite to incorporate meaningful uncertainty around weather, load, renewable generation, and various market price indicators including forward contracts, spot prices, and basis spreads. These risk factors are all simulated at the hourly or sub-hourly level and fed into a variety of asset valuation models that optimize battery storage dispatch, value intermittent generation, and compute payoffs for standard traded products and complex structured transactions.
The result is a detailed and fully-integrated view of the CCA portfolio both today and into the future, enabling more optimal procurement decision-making, more detailed compliance target tracking, and more effective risk management than ever before.
cQuant.io Users Can:
Report confidence intervals (mean, P5, P95, and other quantiles) in cash flows and net attribute positions (MWh, REC, GHG-Free, RA) at the hourly, monthly, and annual levels across the entire portfolio or any user-defined subportfolio.
Easily design and analyze scenarios around complex market phenomena such as negative generation-price covariance, price volatility/correlation, basis spread dynamics, and hourly price shape.
Track progress toward compliance targets or organizational position goals/limits.
Efficiently assess the relative benefits of a broad range of procurement options (e.g., responses to a procurement RFO) and select those that provide the greatest benefit to the portfolio in question.
Break out net open position costs by attribute and view results by month and year.
Monitor portfolio value and risk over time to provide early warning signs of adverse market conditions.